What Is Statistical Significance?
The Core Definition
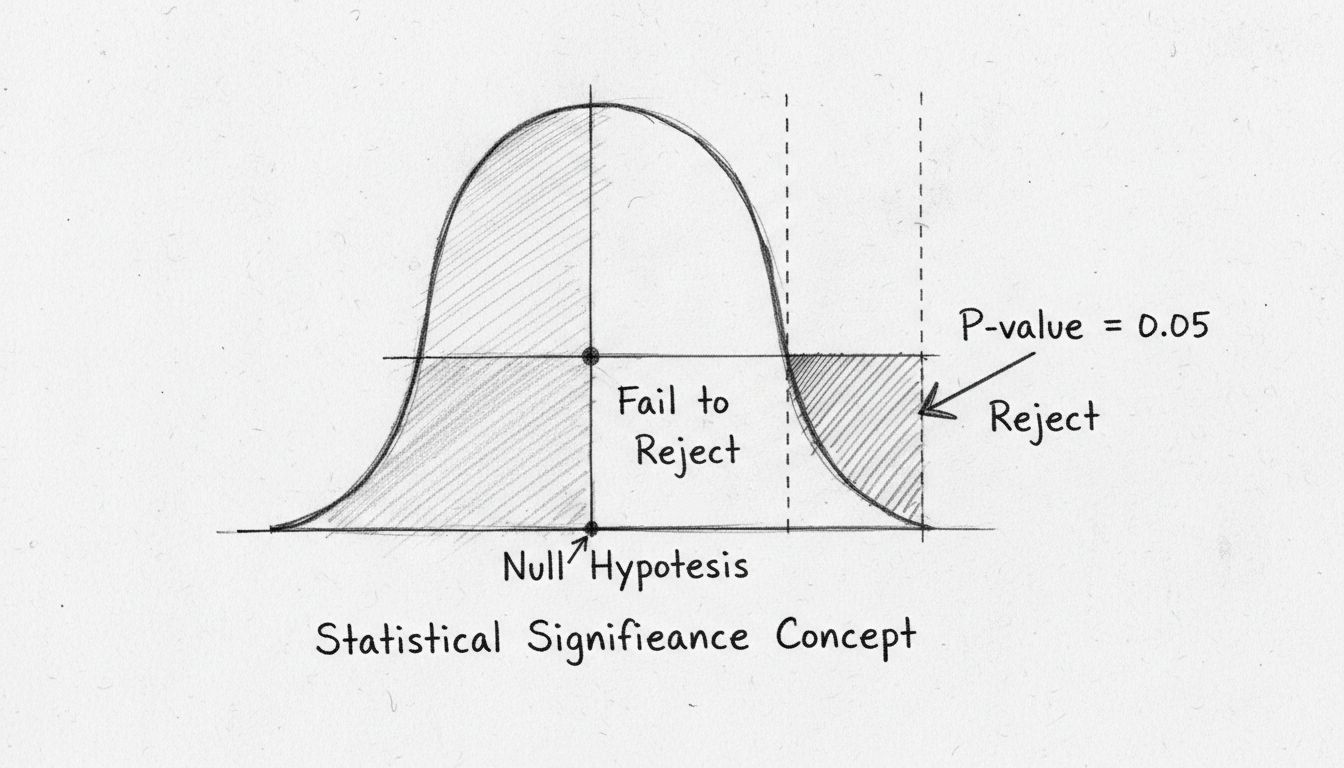
Statistical significance is the likelihood that a relationship between two or more variables is caused by something other than random chance. In formal terms, it is the probability that an observed difference — or one more extreme — would occur if the null hypothesis (the assumption of no real effect) were true.
Statistical Significance vs. Random Chance
Every dataset contains random variation — the natural fluctuation that occurs even when no underlying effect exists. Flip a fair coin 100 times, and you will rarely get exactly 50 heads. That deviation is random noise, not evidence the coin is biased.
Statistical significance quantifies whether the deviation you see is large enough, relative to your sample size, to be unlikely under random noise alone. When it is, you can reject the null hypothesis and conclude that a real effect likely exists.
Two related concepts help here:
- Random chance: The probability that an observed difference arises purely from sampling variability.
- Random variation (or random noise): The inherent unpredictability in any measurement process. Larger samples reduce its influence, making true effects easier to detect.
A Simple Real-World Example
Suppose you run an online store and test two versions of a product page. Version A converts at 4.2%. Version B converts at 4.8%. That is a 0.6 percentage-point difference — but is it real?
If the p-value were 0.30, however, the same gap would be entirely consistent with random chance — and acting on it would be premature.
Launch your affiliate program today
Set up advanced tracking in minutes. No credit card required.
How Statistical Significance Works
The Null Hypothesis and Alternative Hypothesis
Every significance test starts with two competing statements:
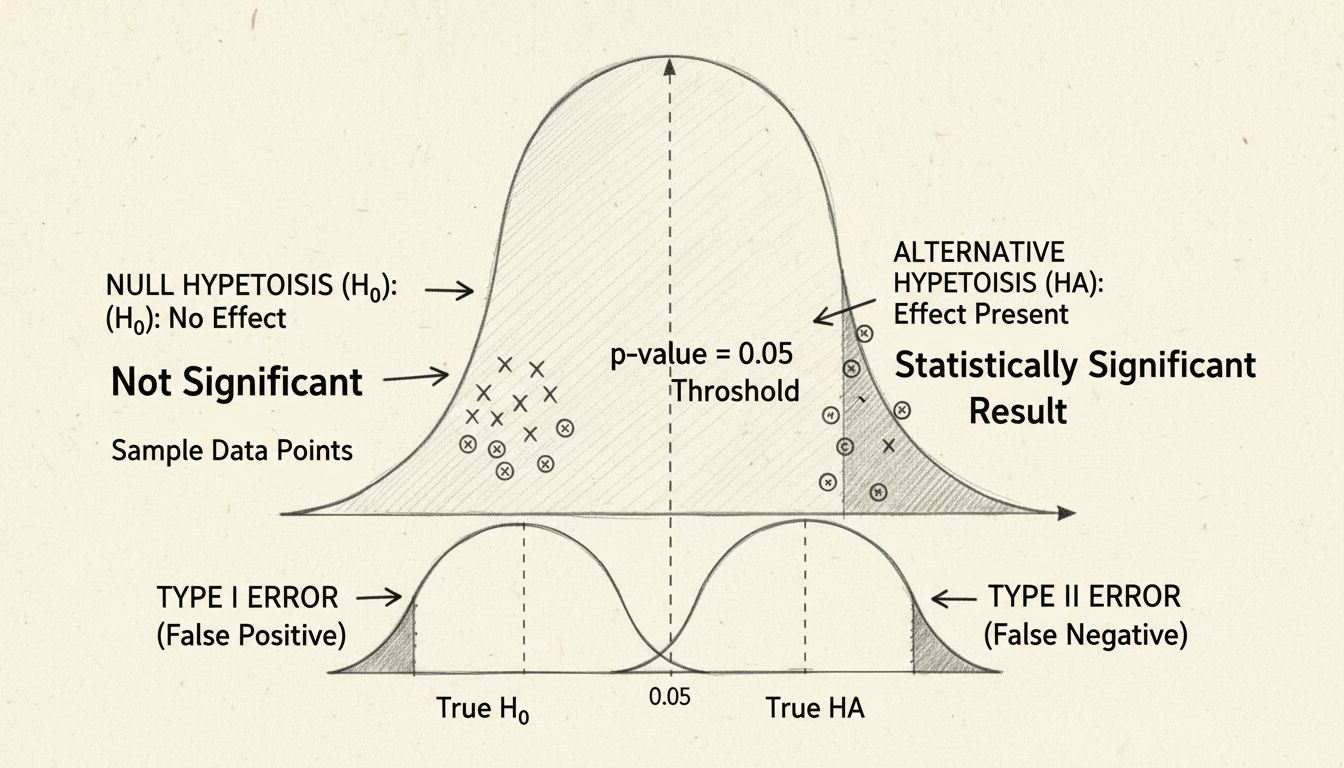
- Null hypothesis (H₀): There is no real difference or relationship. Any observed difference is due to random variation.
- Alternative hypothesis (H₁): There is a real difference or relationship.
Understanding P-Values
Common misinterpretations to avoid:
- p = 0.03 does NOT mean there is a 3% chance the null hypothesis is true. It describes the data’s probability under the null, not the null’s probability given the data.
- p = 0.03 does NOT mean the effect is 97% likely to be real. The p-value says nothing about the probability that the alternative hypothesis is correct.
- A p-value above 0.05 does NOT prove the null hypothesis. It means the data is not surprising enough to reject it — which is a different statement entirely.
Significance Levels (Alpha)
The significance level, denoted α (alpha), is the threshold you set before running a test. It represents your tolerance for false positives — rejecting the null hypothesis when it is actually true. This is also called a Type I error.
| Threshold | Meaning | Risk of False Positive |
|---|
| α = 0.05 | Standard in most fields | 5% (1 in 20) |
| α = 0.01 | Stricter; used when false positives are costly | 1% (1 in 100) |
| α = 0.001 | Very strict; high-stakes decisions | 0.1% (1 in 1,000) |
If p < α, the result is statistically significant at that level.
Confidence Intervals Explained
A confidence interval provides a range of plausible values for the true effect size. A 95% confidence interval means: if you repeated the study 100 times, about 95 of those intervals would contain the true value.
Narrower intervals indicate more precise estimates — typically the result of larger sample sizes. In business contexts, confidence intervals are often more informative than p-values alone because they show the magnitude and direction of an effect, not just whether it exists.
Is 0.05 Statistically Significant? (and Other Thresholds)
The 0.05 Convention
Yes — in most applied fields, p < 0.05 is the standard for claiming statistical significance. This convention traces back to Ronald Fisher’s work in the 1920s, and while somewhat arbitrary, it has persisted because it balances two risks: false positives (Type I errors) and false negatives (Type II errors, where a real effect is missed).
0.01 vs. 0.05: Which Is More Significant?
A p-value of 0.01 is more statistically significant than 0.05 because it indicates a lower probability that the observed result is due to random chance. At α = 0.01, you are accepting only a 1% risk of a false positive, compared to 5% at α = 0.05.
However, a lower p-value does not automatically mean a larger or more important effect. With a massive sample, even a trivially small difference can produce p < 0.001. This is why effect size and practical significance must be evaluated alongside the p-value.
Join our newsletter
Be the first to know about new features and product updates.
Factors That Affect Statistical Significance
Sample Size
Sample size is the single most influential factor. Larger samples reduce the impact of random variation, making it easier to detect true differences. This is why a 2% conversion lift might be significant with 50,000 visitors but not with 500.
Effect Size
Effect size measures the magnitude of the observed difference — not just whether it exists. A large effect size (e.g., a 30% conversion lift) reaches significance faster and with smaller samples. A tiny effect size (e.g., 0.5%) requires enormous samples to detect reliably.
This is where the relationship between statistical significance and practical significance becomes critical. A finding can be statistically significant yet practically irrelevant if the effect is too small to matter for business decisions.
Data Quality
No statistical test can compensate for bad data. Common data-quality problems include:
- Selection bias: The sample does not represent the target population.
- Measurement error: The metric being tracked is unreliable or inconsistent.
- Confounding variables: An unmeasured factor is driving the observed difference.
Before calculating statistical significance, verify that your data collection is clean, consistent, and free of systematic bias. A significant result from flawed data is worse than no result at all.
Statistical Power
Power depends on sample size, effect size, and the chosen significance level. Underpowered studies are a common reason why seemingly promising A/B test results fail to replicate.
The Core Definition
Statistical significance is the likelihood that a relationship between two or more variables is caused by something other than random chance. In formal terms, it is the probability that an observed difference — or one more extreme — would occur if the null hypothesis (the assumption of no real effect) were true.
The framework comes from hypothesis testing, a branch of statistical analysis developed in the early 20th century by Ronald Fisher and refined by Jerzy Neyman and Egon Pearson.
Statistical Significance vs. Random Chance
Every dataset contains random variation — the natural fluctuation that occurs even when no underlying effect exists. Flip a fair coin 100 times, and you will rarely get exactly 50 heads. That deviation is random noise, not evidence the coin is biased.
Statistical significance quantifies whether the deviation you see is large enough, relative to your sample size, to be unlikely under random noise alone. When it is, you can reject the null hypothesis and conclude that a real effect likely exists.
Two related concepts help here:
- Random chance: The probability that an observed difference arises purely from sampling variability.
- Random variation (or random noise): The inherent unpredictability in any measurement process. Larger samples reduce its influence, making true effects easier to detect.
A Simple Real-World Example
Suppose you run an online store and test two versions of a product page. Version A converts at 4.2%. Version B converts at 4.8%. That is a 0.6 percentage-point difference — but is it real?
You run a statistical test. It returns a p-value of 0.03.
If the p-value were 0.30, however, the same gap would be entirely consistent with random chance — and acting on it would be premature.
The Null Hypothesis and Alternative Hypothesis
Every significance test starts with two competing statements:
- Null hypothesis (H₀): There is no real difference or relationship. Any observed difference is due to random variation.
- Alternative hypothesis (H₁): There is a real difference or relationship.
The test does not prove H₁ directly.
This framework applies directly to A/B testing.
Understanding P-Values
Common misinterpretations to avoid:
- p = 0.03 does NOT mean there is a 3% chance the null hypothesis is true. It describes the data’s probability under the null, not the null’s probability given the data.
- p = 0.03 does NOT mean the effect is 97% likely to be real. The p-value says nothing about the probability that the alternative hypothesis is correct.
- A p-value above 0.05 does NOT prove the null hypothesis. It means the data is not surprising enough to reject it — which is a different statement entirely.
Significance Levels (Alpha)
The significance level, denoted α (alpha), is the threshold you set before running a test. It represents your tolerance for false positives — rejecting the null hypothesis when it is actually true. This is also called a Type I error.
| Threshold | Meaning | Risk of False Positive |
|---|
| α = 0.05 | Standard in most fields | — |
| α = 0.01 | Stricter; used when false positives are costly | — |
| α = 0.001 | Very strict; high-stakes decisions | — |
If p < α, the result is statistically significant at that level.
Confidence Intervals Explained
A confidence interval provides a range of plausible values for the true effect size. A 95% confidence interval means: if you repeated the study 100 times, about 95 of those intervals would contain the true value.
Narrower intervals indicate more precise estimates — typically the result of larger sample sizes. In business contexts, confidence intervals are often more informative than p-values alone because they show the magnitude and direction of an effect, not just whether it exists.
The 0.05 Convention
Yes — in most applied fields, p < 0.05 is the standard for claiming statistical significance. This convention traces back to Ronald Fisher’s work in the 1920s, and while somewhat arbitrary, it has persisted because it balances two risks: false positives (Type I errors) and false negatives (Type II errors, where a real effect is missed).
0.01 vs. 0.05: Which Is More Significant?
A p-value of 0.01 is more statistically significant than 0.05 because it indicates a lower probability that the observed result is due to random chance. At α = 0.01, you are accepting only a 1% risk of a false positive, compared to 5% at α = 0.05.
However, a lower p-value does not automatically mean a larger or more important effect. With a massive sample, even a trivially small difference can produce p < 0.001. This is why effect size and practical significance must be evaluated alongside the p-value.
When p < 0.001
A p-value below 0.001 means the observed result would occur by random chance less than 1 in 1,000 times if the null hypothesis were true. This is strong evidence against the null — but it still does not guarantee practical importance.
Sample Size
Sample size is the single most influential factor. Larger samples reduce the impact of random variation, making it easier to detect true differences. This is why a 2% conversion lift might be significant with 50,000 visitors but not with 500.
For low-traffic sites, this means tests must run longer or target larger-effect changes.
Effect Size
Effect size measures the magnitude of the observed difference — not just whether it exists. A large effect size (e.g., a 30% conversion lift) reaches significance faster and with smaller samples. A tiny effect size (e.g., 0.5%) requires enormous samples to detect reliably.
This is where the relationship between statistical significance and practical significance becomes critical. A finding can be statistically significant yet practically irrelevant if the effect is too small to matter for business decisions.
Data Quality
No statistical test can compensate for bad data. Common data-quality problems include:
- Selection bias: The sample does not represent the target population.
- Measurement error: The metric being tracked is unreliable or inconsistent.
- Confounding variables: An unmeasured factor is driving the observed difference.
Before calculating statistical significance, verify that your data collection is clean, consistent, and free of systematic bias. A significant result from flawed data is worse than no result at all.
Statistical Power
Statistical power is the probability that a test will detect a real effect when one exists. It is the complement of the Type II error rate (β).
Power depends on sample size, effect size, and the chosen significance level. Underpowered studies are a common reason why seemingly promising A/B test results fail to replicate.
How to Calculate Statistical Significance
Common Statistical Tests
Different data types call for different tests:
| Test | Use Case | Example |
|---|
| T-test | Comparing means of two groups | Conversion rates: Version A vs. Version B |
| Chi-square test | Comparing categorical frequencies | Click-through rates across multiple ad creatives |
| Z-test | Comparing proportions with large samples | Landing page conversion proportions |
| ANOVA | Comparing means across three or more groups | Performance across multiple affiliate partners |
You do not need to compute statistical significance by hand. Widely used tools include:
- A/B testing platforms (Optimizely, VWO, Google Optimize) — built-in significance calculations
- Standalone calculators (Evan Miller’s tools, AB Testguide) — free, web-based
- Statistical software (R, Python’s SciPy, SPSS) — for custom analysis
Most tools report both the p-value and the confidence interval. Always check both before making a decision.
Step-by-Step Workflow for A/B Testing
- Define your metric: Choose a single primary metric (conversion rate, click-through rate, revenue per visitor).
- Calculate required sample size: Use a sample-size calculator based on your baseline conversion rate and minimum detectable effect.
- Randomize and run the test: Split traffic evenly between control and treatment. Do not stop early.
- Analyze results: Compare p-value to α. Examine the confidence interval for the effect size.
- Decide: If significant and practically meaningful, implement the winning variation. If not, document the finding and test something else.
Statistical Significance in Affiliate Marketing
Statistical significance is not just an academic concept. In affiliate marketing, where commissions, budgets, and partner relationships depend on performance data, it is a practical safeguard against costly misjudgments.
For Advertisers
Advertisers running affiliate programs routinely test landing pages, offer structures, and creative assets. Statistical significance ensures that decisions about which version to scale are based on real performance differences, not random fluctuation.
Example workflow: An advertiser tests two commission structures — a flat 10% rate vs. a tiered 5%/12%/18% model. After 30 days and 5,000 transactions, the tiered model shows 22% higher average order value. A t-test returns p = 0.02. The advertiser can confidently roll out the tiered structure, knowing the observed difference is unlikely to be random noise.
Without significance testing, the advertiser might have made the change based on a short-term fluctuation — and potentially reduced partner earnings if the effect reversed.
For Publishers
Publishers (affiliates) make decisions about which products to promote, which traffic sources to invest in, and which content formats convert best. Each of these decisions benefits from significance testing.
Example workflow: A publisher runs two versions of a review article — one with a comparison table at the top, one with it at the bottom. Over 10,000 pageviews, the top-placement version generates a 3.1% click-through rate to the merchant vs. 2.6% for the bottom placement. A chi-square test gives p = 0.04. The publisher adopts the top-placement format and applies the pattern to other reviews.
For Affiliate Program Managers
Program managers evaluate partner performance, set commission tiers, and decide which affiliates to recruit or retain. Statistical significance helps distinguish consistently high performers from those whose strong months are just variance.
Example workflow: A program manager compares two affiliates with similar traffic volumes. Affiliate A has a 5.2% conversion rate over 12 months; Affiliate B has 4.1%. A two-sample z-test confirms the difference is significant (p = 0.008). The manager uses this data to allocate higher-tier commissions to Affiliate A and investigate what Affiliate B could improve.
In all three roles, the principle is the same: let the data reach significance before you act. Premature decisions — raising commissions for a partner who had one good month, or abandoning a landing page that had one bad week — are among the most common and avoidable mistakes in affiliate marketing.
Limitations and Common Misconceptions
Significant ≠ Important
This is the most persistent misunderstanding. A result can be statistically significant at p < 0.001 and still be too small to matter. In one well-known example from the NIST engineering statistics handbook, a manufacturing process improvement was statistically significant but produced a gain of only 0.2 units — far below the threshold of practical value.
Always ask two questions:
- Is it statistically significant? (the p-value)
- Is the effect large enough to care about? (the effect size)
P-Hacking and the Reproducibility Crisis
P-hacking refers to the practice of running multiple analyses and selectively reporting only those that reach significance. Common forms include:
- Testing many metrics and highlighting the one that “wins”
- Stopping data collection when p crosses 0.05
- Excluding outliers post hoc to nudge the p-value down
These practices dramatically inflate false positive rates.
The lesson for business users: pre-register your test plan, stick to one primary metric, and resist the temptation to fish for significance.
When Not to Rely on Statistical Significance
Statistical significance is less useful — or outright misleading — in these scenarios:
- Very small samples: With fewer than 100 observations per group, only enormous effects will reach significance. Negative results are uninformative, not evidence of no effect.
- Multiple simultaneous changes: If you change five elements of a page at once, a significant result cannot tell you which change drove the effect.
- Low-stakes exploratory work: Not every decision requires formal significance testing. For early-stage exploration, directional data may be sufficient.